


Administrators give ‘State of the District’ report
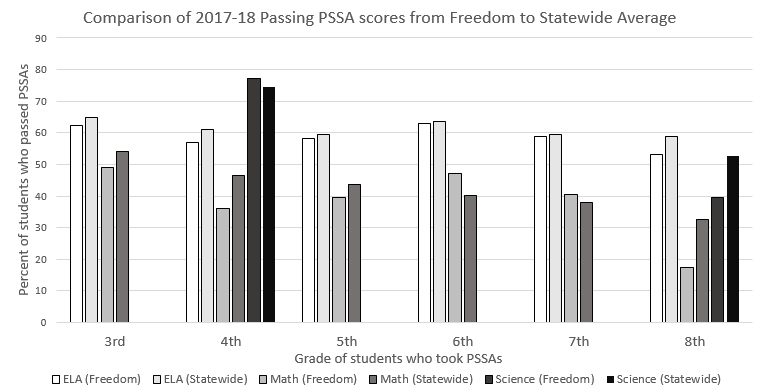
The above charts shows the percentage of students that passed the PSSA that that took last year in the district as well as the statewide average. In order to pass the PSSA, students must score a proficient or advanced.
Much like how the President of the United States gives a State of the Union address, administrators at a school also give an address: the State of the District report. During the school board meeting on Oct. 2, Director of Curriculum and Instruction Misty Slavic and Superintendent Jeffrey Fuller gave an account of how Freedom Area School District is now operating.
The mission and vision of the school district coincide with the Profile of a Bulldog initiative taken on by the school district.
“Our students will be motivated critical thinkers who demonstrate communication, collaboration, innovation, perseverance, and responsibility to become leaders in their chosen fields and in society,” the handout for the State of the District report reads.
The Comprehensive Plan Focus set two goals. One establishing “a district system that fully ensures consistent implementation of standards-aligned curricula”; the school district is creating an online curriculum database to meet this goal, in the form of Naviance. The other goal is to set up “a district system that fully ensures professional development is focused, comprehensive and implemented with fidelity” in the form of Profile of a Bulldog. These initiatives have been taken on by the school district plan to lead for more successful futures for all of its students.
One of the first points the address touched on was enrollment. Overall enrollment in FASD is down slightly from last year and has been on a slight downward trend for the past five years. 1,339 students are enrolled this year, making for an average of 103 students per class for Kindergarten through 12th grade. While enrollment has slightly decreased, the amount of students receiving free or reduced lunches has increased again by .2 percent, meaning 47.4 percent of the district receives free or reduced lunches.
The State of the District report also addressed student health and well-being. Within FASD, there is the Student Assistance Program (SAP). This uses of this program are for identification and support for students who may use alcohol, tobacco, other drugs, and mental health issues which may burden a student’s success in school. In the 2016-17 school year, the SAP program received about 250 referrals. The top three reasons for referral, from first to third, included academic, social concerns and attendance-based reasons. This year so far, 10 students went to Crisis, which means that those students are at a major risk for suicide or have a major mental problem. Last year, a total of 32 students went to Crisis. These students go to a hospital or mental health institution for an evaluation.
Last year, the only Freedom state test scores to reach above the state average were sixth grade math PSSA scores, seventh grade math PSSA scores, and fourth grade science PSSA scores. Students who receive Proficient or Advanced on their PSSA or Keystone exam is considered passing. ELA PSSA scores from third to eighth grades were within five percent of the state average. Math PSSA scores were a bit more spread out. The most noticeable difference was in the eighth grade PSSA scores, where only 17.4 percent of students passed with Proficient or Advanced, compared to the state average of 32.5 percent. Eighth grade science PSSA scores showed 39.4 percent of students passed with Proficient or Advanced, where the state average is 52.7 percent passing.
Keystone scores were much of the same. 30 percent passed the Algebra Keystones, where the state average was 65.6 percent; 52.5 percent passed the Literature Keystones in Freedom, with 72.7 passing statewide; 34.2 percent passed the Biology Keystone and 63.4 percent passed statewide. These numbers represent the percent of students who are enrolled up to 11th grade and have passed Keystones. All of these Keystone exams percent of passing are lower than the state average compared to the PSSA scores.
The last part of the report dealt with improvement planning within the school district. On Oct. 8 — an in-service day for teachers — the school district trained the teachers in Tested Subject Areas. They reviewed the curriculum to make adjustments in correlation to assessment data from district-wide testing, like the PSSAs and Keystones.
In addition to the teachers, a Focus Group is also being created. This group of students and community members will help find strategies for improvement within the school to meet its future goals within the school. The plan is to have a group of students and parents from different backgrounds, like different grades and social classes, to get a full understanding of what goes on inside of the school district. This will help to give more information so more accurate plans will develop to better suit the needs of the school district.
With improvements to come, there might be changes to the way some functionalities and class work within the school. By the end of this school year, the demographics of these areas could be completely different from what they are now.